About 40,000 people die in traffic accidents each year in the U.S. For 2019 the actual data was 39,107 or 11.9 deaths per 100,000 population. So Oakland Township’s “quota” of deaths for our 19,000 residents in 2019 should have been about 2+ people. If we were still at the 1970 death rate of 26.8 per 100,000 we should have expected 5+ deaths among Oakland Township residents.
National Highway Transportation Safety Administration (NHTSA) Deputy Administrator, Steven Cliff is quoted in an Oakland Press February 3rd article on page 1 as saying “We have to change our culture that accepts as inevitable the loss of tens of thousands of people in traffic crashes”. I agree.
It is heartening to see the downward trend in the death rate from 26.8 deaths per 100,000 population in 1970 to 11.9 in 2019. I calculated using the spreadsheet the graph below is made from that this totaled 1,318,237 lives saved since 1970 by whatever we have been doing (seat belts, better road signals, traffic circles, education, safer cars, etc.) to decrease the death rate. That’s a lot of people still alive to pursue “Life, Liberty and Pursuit of Happiness”, not to mention many children and grandchildren who would otherwise never have been born.
Let’s all work together to further reduce traffic deaths a lot more.
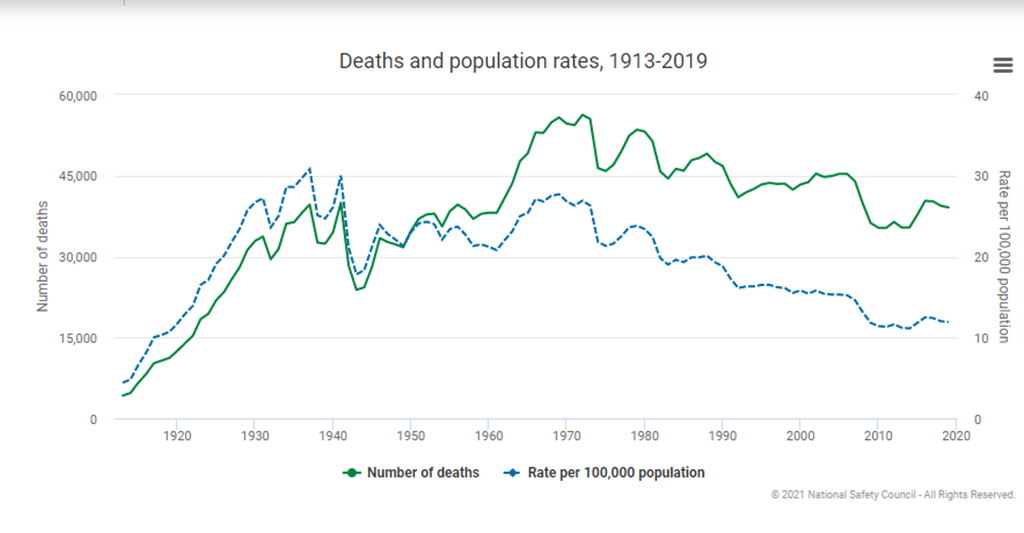
Graph and spreadsheet available here from the National Safety Council.
